Introduction
Here's the contradiction most HVAC owners live with: the schedule is full, the trucks are rolling, and the phones haven't stopped — yet the bank account tells a different story at the end of every month.
Busy doesn't equal profitable. That's the hard truth most contractors learn somewhere around $2–3M in revenue when overhead has grown faster than margins, pricing hasn't kept up with labor costs, and cash flow swings with the seasons.
This guide covers the specific levers that separate 8% net margins from 18%:
- Where your benchmarks should actually sit
- Which profit leaks are most likely draining your P&L right now
- How to structure pricing and maintenance agreements to compound over time
- The underwriting margin flowing out of your business to third-party warranty administrators — and how to recapture it
TLDR
- ACCA benchmarks show well-run HVAC companies should net 10–12% overall, with service/repair at 15–20% and flat-rate service hitting 20–25%
- The four biggest margin drains: stale flat-rate pricing, untracked callbacks, overhead creep, and third-party financing fees absorbed into your costs
- Maintenance agreements build recurring revenue only when priced to cover true loaded costs, not just direct labor
- Most HVAC contractors unknowingly fund a third party's profits through warranty programs — owning that structure keeps 100% of those profits in-house
HVAC Profit Margin Benchmarks: Where Do You Stand?
Gross Margin vs. Net Margin
These two numbers get conflated constantly, and the confusion creates bad decisions.
Gross margin is revenue minus direct job costs — labor, materials, and equipment. Net margin is what remains after overhead, marketing, owner compensation, and everything else. A shop can run 50% gross margin and 6% net margin simultaneously, which means overhead is consuming the difference.
According to ACCA's profit benchmarks, a well-run HVAC company should generate 10–12% overall net profit. But the number shifts significantly by work type:
| Service Type | Net Profit Target |
|---|---|
| Flat-rate service | 20–25% |
| Service & repair | 15–20% |
| Equipment replacement | 10–12% |
| Large commercial projects | 3–5% |
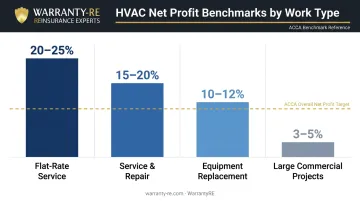
The jump from 15–20% on service/repair to 20–25% on flat-rate service isn't magic — it's what happens when pricing is locked in before the truck rolls and technicians aren't rushing through jobs to reduce the customer's hourly bill. Those margin gaps become harder to see when you average everything together.
Why Your Blended Margin Lies to You
Running a blended margin across all work types hides what's actually happening. A shop doing 80% replacement and 20% service looks fine at 11% net — but is leaving margin on the table because the high-margin service work is being diluted by equipment-heavy installs.
Track margin separately by department:
- Service calls — typically your highest-margin work
- Installations — volume-driven, lower net due to equipment costs
- Maintenance agreements — predictable, recurring, and often underpriced
Once you know which line is pulling the average down, you know exactly where to focus first.
The Biggest Profit Leaks Draining HVAC Margins
Stale Pricing and Flat-Rate Books
Flat-rate pricing controls margin better than time-and-materials because it removes the guesswork. It only works if the price book reflects current costs — and most don't.
The cost pressures have been relentless:
- HVAC product inflation ran approximately 40% from 2020 to 2023, per HVACR Business
- The BLS reports the median HVAC technician wage hit $59,810 in May 2024 — and that's the median, not what competitive markets pay to retain good people
- The FRED Producer Price Index for HVAC equipment has climbed steadily through early 2025
A price book built two years ago and never updated is silently delivering less margin on every job. ACCA's cost modeling shows that charging $89 for a 30-minute call leaves roughly $4.60 per hour in actual profit once loaded truck costs are factored in. That's a structural pricing failure, not a rounding error.
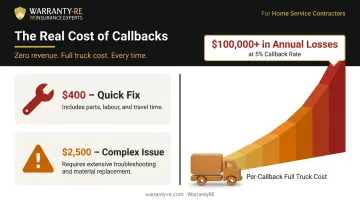
Callback and Warranty Work Costs
Every callback is a net-negative P&L event. That means zero revenue, full truck cost, technician time, and often replacement parts.
ACCA puts the cost range at $400 for a quick fix up to $2,500 for more involved issues — and estimates that a 5% callback rate can exceed $100,000 in annual losses. The tracking mistake most shops make is attributing the callback to the tech who resolved it, not the one who caused it. That prevents coaching and hides the true cost center.
Overhead Creep
ACCA's residential service model assumes overhead of $40–$50 per hour as the baseline. Overhead creep is cumulative: a software subscription nobody uses, an admin role that expanded beyond its original scope, a facility lease that made sense at $1.5M revenue but drags at $3M.
On a $5M company, every 1% of excess overhead equals $50,000 in lost annual profit. Five percent of excess overhead is $250,000 that should have been net income.
Dealer Fees on Third-Party Financing
ACCA data shows contractors who consistently offer financing see close rates increase 30% and average ticket grow 20%. Successful contractors typically finance over 65% of jobs. That financing volume matters — and so do the fees.
Third-party financing platforms charge dealer fees that can run several percentage points of the financed amount. On a $12,000–$15,000 changeout, that's hundreds of dollars off the top before any work begins. The fix: build the dealer fee cost into the flat-rate price so financed jobs don't drag install margins below the rest of the work.
Uncontrolled Discounting
A $200 field discount feels like a closed deal. Multiplied across 200 installs annually, it's $40,000 in margin that evaporated without a single line item on the P&L.
Ad-hoc discounts given to close a deal or match a competitor erode average ticket with no visibility into the cumulative impact. The fix is a written discount policy that governs:
- When discounts are permitted — not left to in-the-moment judgment
- How much can be offered — grounded in actual margin math, not competitive pressure
- Who has authority to approve — removing the decision from the point of pressure
That structure keeps individual field calls from quietly compounding into a six-figure margin problem.
Pricing Strategies That Actually Move the Needle
Commit to Flat-Rate Pricing — and Keep It Current
ACCA's own data makes the case clearly: service/repair net profit runs 15–20% generally, but rises to 20–25% when a service department implements flat-rate pricing. The pricing model itself shifts the outcome.
The catch: flat-rate adoption without regular price book updates eliminates most of the benefit. Pricing discipline requires both the structure and the maintenance.
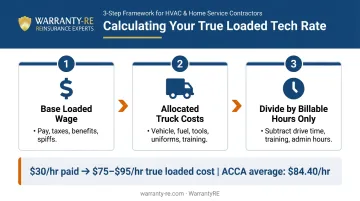
Calculate Your True Loaded Tech Rate
Most shops know what they pay a technician. Few know what that technician actually costs per billable hour. The calculation has three steps:
- Base loaded wage — hourly pay plus payroll taxes, benefits, and spiffs
- Allocated truck costs — vehicle payment/depreciation, fuel, tools, uniforms, training
- Divide by billable hours, not paid hours — subtract drive time, training, shop time, and administrative hours
A tech paid $30/hour might carry a loaded cost of $75–$95/hour once non-billable time is factored in. ACCA puts average truck-roll cost at roughly $84.40 per hour including wages, benefits, vehicle costs, insurance, and non-billable windshield time. Service call pricing must cover that full loaded rate or every call quietly erodes margin.
Shift Revenue Mix Toward Higher-Margin Work
A shop running 80% install and 20% service is leaving margin on the table. Service and repair carries 10–15 net margin points above replacement work by ACCA's benchmarks.
Shifting that mix doesn't require raising prices. It requires marketing:
- Proactive tune-up campaigns during shoulder seasons
- Maintenance agreement enrollment at every service call
- IAQ add-ons (UV lights, purifiers, whole-home humidifiers) with minimal incremental job time
Each shift in revenue mix toward service lifts blended margin without a single price increase on any line item.
Tiered Proposals and Technician Compensation Alignment
Presenting customers with a Good/Better/Best proposal converts "should I buy" into "which option fits me." Customers regularly choose up when given a structured choice. The same logic applies to maintenance agreements (covered in the next section).
Compensation structure is a separate lever — and one most shops ignore. Paying technicians on revenue rather than gross profit creates a misalignment: techs push higher-ticket jobs regardless of margin quality. Shifting comp to reward gross profit generated changes field behavior directly. Consider the contrast:
- Revenue-based comp: Techs maximize ticket size, regardless of margin
- Gross profit-based comp: Techs prioritize jobs and add-ons that actually improve margin quality
That single structural change typically improves blended margin without any price increases or new service offerings.
Maintenance Agreements as a Recurring Revenue Engine
Price Agreements to Cover True Loaded Costs
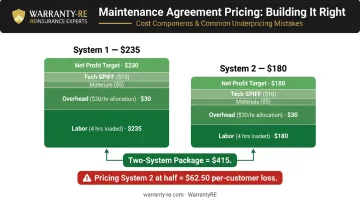
The most common maintenance agreement mistake: pricing based on direct labor and parts while ignoring full cost allocation.
HVACR Business published a detailed cost build-up showing a two-visit annual agreement for a primary system should be priced around $235 based on:
- 4 hours including travel at loaded rates
- $20/hour technician base, $30/hour overhead allocation
- $5 materials and consumables
- $10 technician SPIFF
- $5/hour net profit target
A second system, with one travel hour removed, prices at $180 — making a two-system package $415. Pricing that second system at half the first ($117.50) creates a $62.50 per-customer loss on every multi-system household. Multiply that across hundreds of agreement customers and the "deal" becomes a real cost.
Agreements priced below loaded costs quietly drain margin with every renewal cycle.
Structure Tiered Packages to Capture More Revenue
The Good/Better/Best model applied to agreements:
| Tier | Components |
|---|---|
| Basic | One seasonal visit, standard inspection, small repair discount |
| Mid-Tier | Two seasonal visits, priority scheduling, enhanced discount, waived overtime fees |
| Premium | Two visits plus emergency coverage, 24/7 response, extended parts and labor warranty |
The mid-tier captures most sign-ups; the premium tier anchors price perception upward. Three options shift the customer's focus from whether to buy to which level makes sense for their home.
Renewal Systems and Annual Price Escalation
Target a minimum 80% renewal rate. Natural attrition shrinks the base every year without active renewal management. Replacing churned agreements means paying full acquisition costs for customers you already had.
Best practices:
- Handle renewals during the final tune-up visit, not by mail
- Send automated reminders 60–90 days before expiration
- Build annual price escalation clauses (tied to CPI or labor indices) into every agreement from the start
Agreements priced three years ago and never adjusted are delivering less margin every year as labor and materials costs compound upward. An escalation clause simply keeps agreement pricing aligned with what the work actually costs to deliver.
The Hidden Profit Layer: Capturing What You're Currently Sending Away
Every HVAC contractor offering a labor warranty is already absorbing the warranty risk. The only question is whether the premium that covers that risk stays in the business or flows to a third party.
When warranty coverage routes through a third-party administrator, the contractor pays for the program. Claims get paid. But when actual claims run below reserves — which is the norm in a well-run operation — the remaining funds become profit that stays with the third-party provider. The contractor took the risk; someone else kept the return.
How the Reinsurance Structure Works
HVAC contractors can establish their own administrator obligor reinsurance company — a structure that holds premium funds inside a contractor-owned entity, pays claims from that pool, and retains 100% of underwriting profits. Unused reserves not consumed by claims accumulate in a tax-advantaged structure under IRS Code 831(b), which allows qualifying property and casualty insurance companies to be taxed only on investment income rather than underwriting income. For 2025, the IRS sets the premium limit at $2,850,000 under Rev. Proc. 2025-13.
The practical structure for an HVAC contractor looks like this:
- A warranty fee is built into every installation proposal
- Fees flow into the contractor-owned reinsurance company
- Claims are paid from that account, fully administered by the program manager
- Unused reserves remain in the contractor's structure — not the TPA's
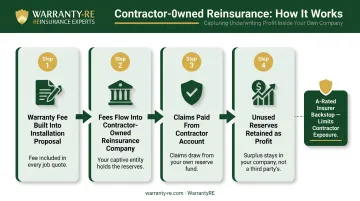
The A-rated insurer backing the structure serves as a backstop: if reserves are insufficient to meet claims, the ultimate liability rests with the direct writing carrier. The contractor's exposure is limited to formation costs plus accumulated earnings.
The Scale Impact
On a business completing hundreds of installations annually, the underwriting profit retained through a reinsurance structure can exceed the gross profit on the installations themselves. The math is straightforward: premium dollars collected minus claims paid equals retained profit, and that retained profit compounds inside a tax-advantaged vehicle year over year.
WarrantyRE has helped over 400 businesses implement this structure since 1994. Everything is handled on the contractor's behalf, including:
- Full program setup and legal entity formation
- All legal forms, filings, and annual renewals
- Monthly financial statements and tax return preparation
- Claims administration and compliance management
This structure works across a range of installation volumes — not just at the high end. Contractors who want to know whether it fits their business can request a free owner analysis directly from WarrantyRE.
Frequently Asked Questions
What is a good profit margin for an HVAC company?
A good net margin is 12% or above, with top-performing service departments reaching 15–25% depending on work mix and pricing model. Gross margin should run 45–55%+ blended. Contractors below 10% net almost always have addressable leaks in pricing, overhead, or service mix — not a market problem.
Can you make $200K in HVAC?
Yes, but it requires the right structure. Owner compensation needs to appear as a defined salary line on the P&L — not "whatever's left." Supporting $200K in owner pay typically requires $1.5M–$3M+ in revenue at healthy margins, with room to reinvest.
What is the average net profit margin for a residential HVAC company?
Most residential HVAC companies net between 5–12%, with the median around 7–8%. Well-run operations with strong service mix, flat-rate pricing, and overhead discipline consistently reach double digits. The gap between average and top performers comes down to a handful of operational decisions, not market conditions.
What are the biggest profit leaks for HVAC contractors?
Four issues show up repeatedly: flat-rate price books that haven't kept pace with labor and material costs, untracked callback expenses, third-party financing dealer fees absorbed into margin instead of priced in, and overhead that hasn't been audited as the business has grown.
How do maintenance agreements improve HVAC profitability?
Agreements create predictable recurring revenue, smooth out seasonal swings, and improve technician utilization in shoulder months. The catch: they must be priced to cover true loaded costs — overhead allocation, travel time, and admin — or they become loss leaders rather than profit contributors.
How can HVAC contractors keep more profit from their warranty programs?
Contractors routing warranties through third-party administrators give up the underwriting margin — the spread between premiums collected and claims paid. By owning a reinsurance structure, contractors retain 100% of unused reserves as profit in a tax-advantaged vehicle under IRC 831(b), turning warranty programs from a cost item into a compounding profit center.